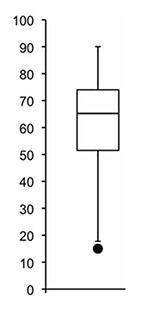
Which of the following is true of the data represented by the box plot?
a. the data is...

Mathematics, 23.10.2019 05:00 dondre54
Which of the following is true of the data represented by the box plot?
a. the data is skewed to the bottom and contains one outlier.
b. the data is skewed to the top.
c. the data has a symmetrical distribution and contains no outliers.
d. the mean is most likely greater than the median.

Answers: 3


Other questions on the subject: Mathematics
Mathematics, 21.06.2019 13:00, smortandsons
(98 points) i need with 5 questions. answer definitions are welcomed, but not necessary.
Answers: 3
Mathematics, 21.06.2019 20:30, corbeansbrain
Someone answer asap for ! michele pushes a box d meters across a floor. she uses a force f, in newtons, to push the box. she pushes the box for t seconds. the formula p = fd/t calculates the power, p, in watts, that it takes for michele to complete the task. solve the formula for d.
Answers: 2
Mathematics, 22.06.2019 01:30, exoticbunnylover123
If a sprinkler waters 1 over 12 of a lawn in 1 over 2 hour, how much time will it take to water the entire lawn? (5 points) 10 hours 6 hours 1 over 6 hour 7 over 12 hour
Answers: 1
You know the right answer?
Questions in other subjects:

Social Studies, 09.10.2019 14:10
Mathematics, 09.10.2019 14:10

Mathematics, 09.10.2019 14:10

Mathematics, 09.10.2019 14:10
History, 09.10.2019 14:10
Mathematics, 09.10.2019 14:10


