
Mathematics, 21.10.2019 14:00 skgoldsmith
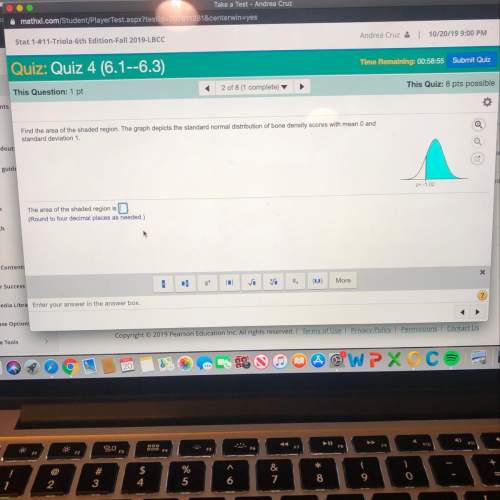
Find the area of the shaded region. the graph depicts the standard normal distribution of bone density scores with mean 0 and
standard deviation 1.
z-102
the area of the shaded region is
(round to four decimal places as needed.)
1
.
-
vos
() moro
a enter your answer in the answer box.
copyright © 2019 pearson education inc. all rights reserved.
terms of use | privacy policy | permissions 1 contact us

Answers: 1


Other questions on the subject: Mathematics
Mathematics, 21.06.2019 17:00, MustafaEtroshi
Find dy/dx using implicit differentiation ln(20+e^xy)=y
Answers: 3
Mathematics, 21.06.2019 17:00, joejoefofana
Need on this one asap im almost done with this subject
Answers: 1
Mathematics, 21.06.2019 21:30, mcaninch36
Scott’s bank account showed a balance of $750 on sunday. during the next five days, he made one deposit of $140 and numerous withdrawals of $180 each. let x represent the number of withdrawals that scott made. write an inequality that can be used to find the maximum number of withdrawals that scott could have made and maintain a balance of at least $100. do not use a dollar sign ($) in your response.
Answers: 1
Mathematics, 21.06.2019 22:00, goodperson21
White shapes and black shapes are used in a game. some of the shapes are circles. while the rest are squares. the ratio of the number of white shapes to the number of black shapes is 5: 11. the ratio of the number of white cicrles to the number of white squares is 3: 7. the ratio of the number of black circles to the number of black squres is 3: 8. work out what fraction of all the shapes are circles.
Answers: 2
You know the right answer?
Find the area of the shaded region. the graph depicts the standard normal distribution of bone densi...
Questions in other subjects:
Mathematics, 21.02.2022 01:10


Chemistry, 21.02.2022 01:10

English, 21.02.2022 01:10

Mathematics, 21.02.2022 01:10


