
Mathematics, 17.10.2019 18:10 radusevciuc7719
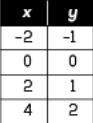
the table describes the coordinates of several points on a graph. they form a proportion.
what characteristic of the values in the table shows that they form a proportion?
a. both columns include both positive and negative numbers.
b. the numbers in the x column increase by a constant amount.
c. each number in the x column relates to only one number in the y column.
d. every number in the x column can be multiplied by the same value to get the number in the y column.

Answers: 1
 with each x-values, we will obtain each y-value pair.


Other questions on the subject: Mathematics
Mathematics, 21.06.2019 17:30, AzuraSchaufler
The graph below represents the number of dolphins in a dolphin sanctuary. select all the key features of this function.
Answers: 2
Mathematics, 21.06.2019 22:00, yay47
Worth 100 points need the answers asap first row -x^2 2x^2 (x/2)^2 x^2 x is less than 2 x is greater than 2 x is less than or equal to 2 x is greater than or equal to 2 second row -5 -5/2 4 5 •2 is less than x& x is less than 4 •2 is less than or equal to x & x is less than or equal to 4 •2 is less than or equal to x& x is less than 4 •2 is less than x& x is less than or equal to 4
Answers: 1
You know the right answer?
the table describes the coordinates of several points on a graph. they form a proportion.
Questions in other subjects:

Mathematics, 11.10.2020 03:01

Biology, 11.10.2020 03:01

Physics, 11.10.2020 03:01
English, 11.10.2020 03:01


