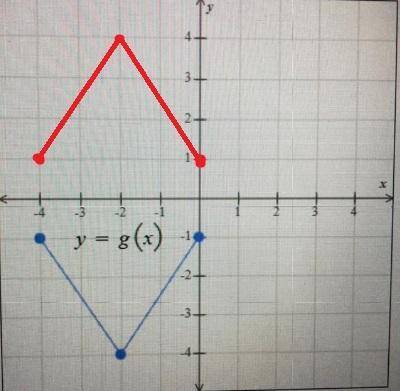
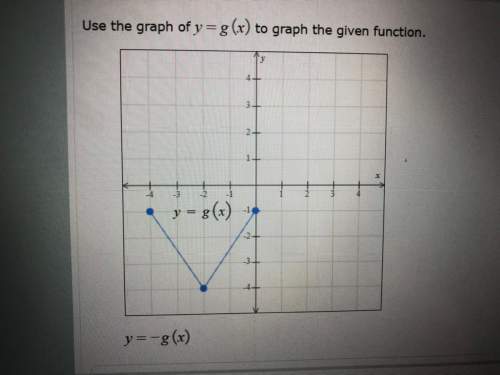
Use the graph of y =g(x) to graph the given function.
...

Mathematics, 10.10.2019 06:00 jordandabrat
Use the graph of y =g(x) to graph the given function.

Answers: 3


Other questions on the subject: Mathematics
Mathematics, 21.06.2019 19:30, tiwaribianca475
Cor d? ? me ? max recorded the heights of 500 male humans. he found that the heights were normally distributed around a mean of 177 centimeters. which statements about max’s data must be true? a) the median of max’s data is 250 b) more than half of the data points max recorded were 177 centimeters. c) a data point chosen at random is as likely to be above the mean as it is to be below the mean. d) every height within three standard deviations of the mean is equally likely to be chosen if a data point is selected at random.
Answers: 1
Mathematics, 21.06.2019 19:30, iicekingmann
Is the power produced directly proportional to the wind speed, give reasons for your answer?
Answers: 1
Mathematics, 21.06.2019 20:00, demetriascott20
Write the point-slope form of the line passing through (2, -12) and parallel to y=3x.
Answers: 2
Mathematics, 21.06.2019 20:30, Travisbennington
Three numbers x, y, and z are in the ratio 2: 7: 8. if 12 is subtracted from y, then three numbers form a geometric sequence (in the order x, y–12, z). find x, y, and z. there are 2 sets.
Answers: 1
You know the right answer?
Questions in other subjects:

Mathematics, 12.02.2021 09:20


Mathematics, 12.02.2021 09:20

Mathematics, 12.02.2021 09:20


