Hlp
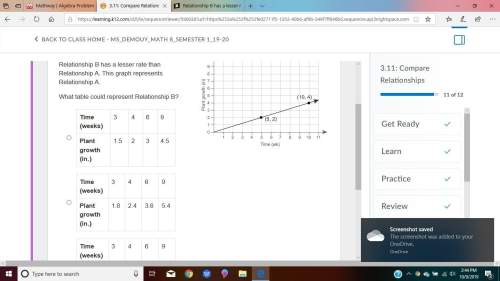
relationship b has a lesser rate than relationship a. this graph represents relationship a...

Mathematics, 10.10.2019 01:30 navarreteanamen123
Hlp
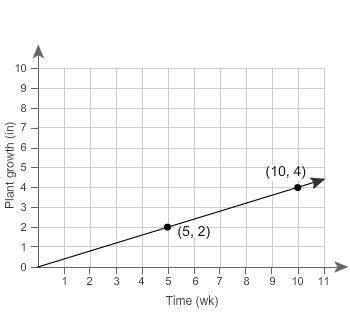
relationship b has a lesser rate than relationship a. this graph represents relationship a.
what table could represent relationship b?
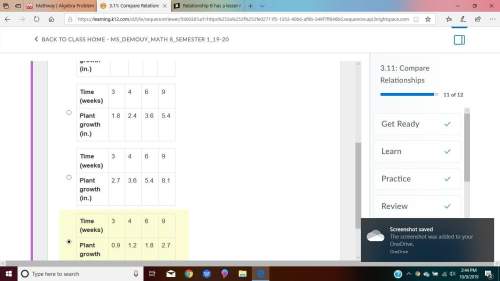
a. time (weeks)
3 4 6 9
plant growth (in.)
1.5 2 3 4.5
b. time (weeks)
3 4 6 9
plant growth (in.)
1.8 2.4 3.6 5.4
c. time (weeks)
3 4 6 9
plant growth (in.)
2.7 3.6 5.4 8.1
d. time (weeks)
3 4 6 9
plant growth (in.)
0.9 1.2 1.8 2.7


Answers: 1


Other questions on the subject: Mathematics
Mathematics, 21.06.2019 19:30, Riley3833
Koji is installing a rectangular window in an office building. the window is 823 feet wide and 534 feet high. the formula for the area of a rectangle is a=bh. what is the area of the window? enter your answer as a mixed number in simplest form in the box. $$ ft2
Answers: 1
Mathematics, 21.06.2019 23:30, lakeshia8880
At your job you're paid $50 per week plus $3 per sale at least how many saled do you need to make in order to have over $250
Answers: 1
Mathematics, 22.06.2019 02:00, JarretteWhitaker
Suppose you can spend at most $12. create an inequality that represents this restraint. then find at least three ordered pair solutions representing the number of boxes of candy and combos you can buy
Answers: 3
You know the right answer?
Questions in other subjects:


Mathematics, 16.02.2022 02:10


Mathematics, 16.02.2022 02:10


