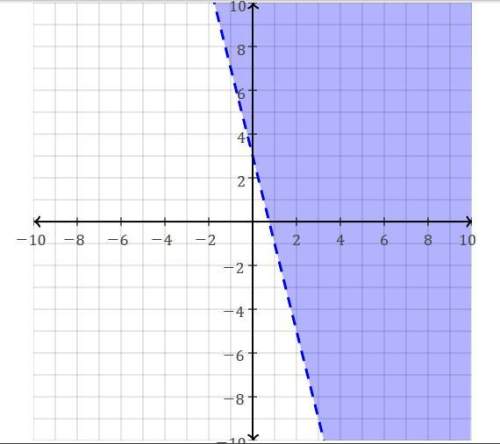
(69 pts! ) which inequality does the given graph represent?
a) y > 4x + 3 b) y >...

Mathematics, 07.10.2019 21:00 jholland03
(69 pts! ) which inequality does the given graph represent?
a) y > 4x + 3 b) y > −4x + 3 c) y > 1 4 x + 3 d) y < − 4x + 3

Answers: 2


Other questions on the subject: Mathematics
Mathematics, 21.06.2019 22:20, anicholson41
Question 9 of 10 2 points suppose your sat score is 1770. you look up the average sat scores for students admitted to your preferred colleges and find the list of scores below. based on your sat score of 1770, which average score below represents the college that would be your best option? o a. 1790 o b. 2130 o c. 2210 od. 1350
Answers: 3
Mathematics, 22.06.2019 06:20, mimireds8573
Which statement regarding efg are true? check all that apply
Answers: 3
You know the right answer?
Questions in other subjects:


