
Mathematics, 06.10.2019 04:30 graceduke2005p6z8yp
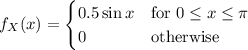
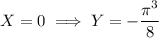
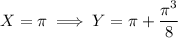
Ga random variable x has a probability density function fx(x) = ? 0.5 sin(x) , 0 ≤ x ≤ π 0 , otherwise another random variable y is defined as y = x + (x − π/2)3 . (a) what are the mean (expected value), variance and standard deviation of x? (b) plot the function y = y (x). what are the minimum and maximum possible values of y ? (c) from the plot, using only graphical thinking and no equations, what is the shape of the probability density function of y (i. e., fy ( specifically, how is the shape compared to that of fx(x)? (d) from the plot, using only graphical thinking and no equations, estimate (guess) the expected value and standard deviation of y (i. e., µy and σy ).

Answers: 1
 is
is![E[X]=\displaystyle\int_{-\infty}^\infty xf_X(x)\,\mathrm dx=\frac12\int_0^\pi x\sin x\,\mathrm dx=\frac\pi2](/tpl/images/0292/1275/34110.png)
![\mathrm{Var}[X]=E[(X-E[X])^2]=E[X^2]-E[X]^2](/tpl/images/0292/1275/14d23.png)
![E[X^2]=\displaystyle\int_{-\infty}^\infty x^2f_X(x)\,\mathrm dx=\frac12\int_0^\pi x^2\sin x\,\mathrm dx=\frac{\pi^2-4}2](/tpl/images/0292/1275/e76b7.png)
![\mathrm{Var}[X]=\dfrac{\pi^2-4}2-\dfrac{\pi^2}4=\dfrac{\pi^2-8}4](/tpl/images/0292/1275/d8297.png)
![\sqrt{\mathrm{Var}[X]}=\dfrac{\sqrt{\pi^2-8}}2](/tpl/images/0292/1275/3d451.png)


Other questions on the subject: Mathematics
Mathematics, 21.06.2019 17:30, ultimateapes
Jacks bank statement shows an account balance of -$25.50. which describes the magnitude, of size, of the debt in dollars
Answers: 2
Mathematics, 21.06.2019 19:30, zetrenne73
Jada has a meal in a restaurant she adds up the prices listed on the menu for everything they ordered and gets a subtotal of $42.00. when the check comes, it says they also need to pay $3.99 in sales tax. what percentage of the subtotal is the sales tax
Answers: 2
You know the right answer?
Ga random variable x has a probability density function fx(x) = ? 0.5 sin(x) , 0 ≤ x ≤ π 0 , otherw...
Questions in other subjects:


Mathematics, 28.01.2020 13:33

Health, 28.01.2020 13:33
Mathematics, 28.01.2020 13:33

Biology, 28.01.2020 13:33
History, 28.01.2020 13:33


