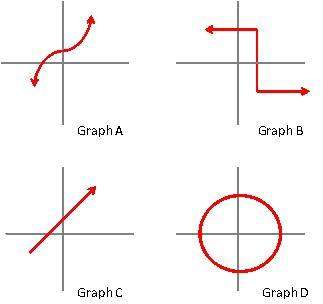
Which of the following graphs represent a function?
a.
graph a and graph c
...

Mathematics, 04.10.2019 22:30 yazmineespinozarive
Which of the following graphs represent a function?
a.
graph a and graph c
b.
graph a
c.
graph d
d.
graph b and graph d

Answers: 3


Other questions on the subject: Mathematics
Mathematics, 21.06.2019 12:30, dondre54
To complete your spring schedule, you must add calculus and physics. at 9: 30, there are three calculus sections and two physics sections; while at 11: 30, there are two calculus sections and three physics sections. how many ways can you complete your schedule if your only open periods are 9: 30 and 11: 30?
Answers: 2
Mathematics, 21.06.2019 16:30, SKYBLUE1015
Which elements in the set below are integers? 12, –3⁄4,√ 25 , –7, √ 5 , 14⁄7, 9 a. 12, √ 25 , –7, 9 b. 12, √ 25 , –7, 14⁄7, 9 c. –3⁄4, 25 , √ 5 ,14⁄7 d. 12, –7, 9
Answers: 2
Mathematics, 22.06.2019 03:00, SmolBeanPotato
Which equation is graphed here? a) y = -3x + 3 b) y = -3x - 3 c) y = -1 3 x +3 d) y = -1 3 x -3
Answers: 1
Mathematics, 22.06.2019 05:00, Flowershere121
Draw a number line to represent the inequality y< 64
Answers: 2
You know the right answer?
Questions in other subjects:


Arts, 06.11.2020 19:30

Health, 06.11.2020 19:30
Mathematics, 06.11.2020 19:30

Computers and Technology, 06.11.2020 19:30


