
Mathematics, 03.10.2019 06:10 brittanysanders
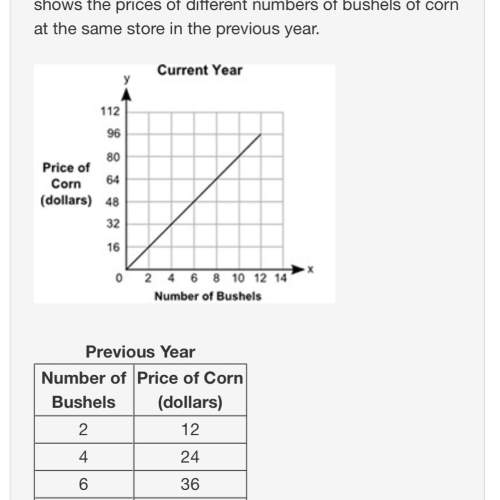
The graph shows the prices of different numbers of bushels of corn at a store in the current year. the table shows the prices of different numbers of bushels of corn at the same store in the previous year.
a graph shows number of bushels on x-axis and price of corn in dollars on y-axis. the x-axis scale is shown from 0 to 14 at increments of 2, and the y-axis scale is shown from 0 to 112 at increments of 16. a straight line joins the ordered pairs 2, 16 and 4, 32 and 6, 48 and 8, 64 and 10, 80 and 12, 96.
previous year
number of bushels
price of corn (dollars)
2
12
4
24
6
36
8
48
part a: describe in words how you can find the rate of change of a bushel of corn in the current year, and find the value. (5 points)
part b: how many dollars more is the price of a bushel of corn in the current year than the price of a bushel of corn in the previous year? show your work. (5 points)

Answers: 3


Other questions on the subject: Mathematics
Mathematics, 21.06.2019 14:30, eliascampos823
2x - 20 = 32 20 - 3x = 8 6x - 8 = 16 -13 - 3x = -10
Answers: 2
Mathematics, 21.06.2019 18:00, gyexisromero10
The estimated number of people to attend the last bengals game of the season was 2000. the actual number of fans attending was 1200. by what percent did the estimate differ from the actual?
Answers: 3
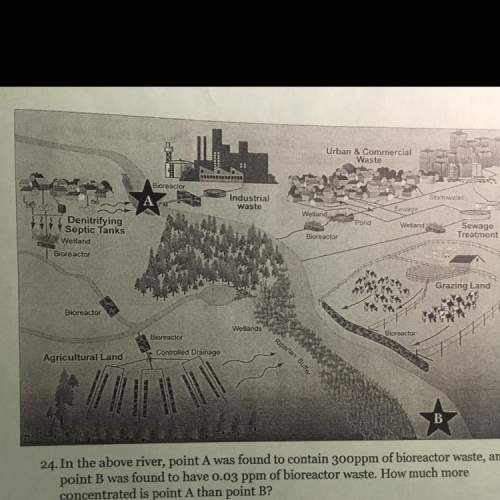
You know the right answer?
The graph shows the prices of different numbers of bushels of corn at a store in the current year. t...
Questions in other subjects:


Biology, 26.03.2021 21:20


