
Mathematics, 03.10.2019 00:20 robertgib76
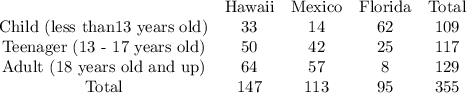
The two-way table shows the preferred vacation destination for people in different age groups. a 5-column table has 4 rows. the first column has entries child (less than 13 years old), teenager (13 to 17 years old), adult (18 years old and up), total. the second column is labeled hawaii with entries 33, 50, 64, 147. the third column is labeled mexico with entries 14, 42, 57, 113. the fourth column is labeled florida with entries 62, 25, 8, 95. the fifth column is labeled total with entries 109, 117, 129, 355. which statement is true? the probability that a randomly selected adult chose hawaii as the preferred destination is startfraction 147 over 355 endfraction. the probability that a randomly selected person who chose hawaii as the preferred destination is a teenager is startfraction 33 over 50 endfraction. the probability that a randomly selected child chose florida as the preferred destination is startfraction 62 over 95 endfraction. the probability that a randomly selected person who chose mexico as the preferred destination is a child is startfraction 14 over 113 endfraction.

Answers: 3


Other questions on the subject: Mathematics
Mathematics, 22.06.2019 00:30, mercydiaz84
Measure a and b and find their sum. how are the angles related?
Answers: 3
Mathematics, 22.06.2019 02:00, michaellowe8434
1. solve the system of equations by graphing: y = -3x - 3 m = b = y = 2x + 2 m = b = plz solve now
Answers: 1
Mathematics, 22.06.2019 05:20, iPlayOften3722
Ted and meg have each drawn a line on the scatter plot shown below: the graph shows numbers from 0 to 10 on x and y axes at increments of 1. dots are made at the ordered pairs 1, 8 and 2, 7.5 and 3, 6 and 4, 5.5 and 4.5, 4.8 and 5, 4 and 6, 3.5 and 7, 3 and 8, 1.9 and 9, 1.2 and 10, 0. a straight line labeled line p joins the ordered pairs 0, 8.5 and 10.1, 0. a straight line labeled line r joins the ordered pairs 0, 8.5 and 7.8, 0. which line best represents the line of best fit? line p, because it is closest to most data points line p, because it shows a positive association line r, because it is closest to most data points line r, because it shows a negative association
Answers: 1
You know the right answer?
The two-way table shows the preferred vacation destination for people in different age groups. a 5-c...
Questions in other subjects:
Mathematics, 19.11.2020 20:40

History, 19.11.2020 20:40
Mathematics, 19.11.2020 20:40

Health, 19.11.2020 20:40

Biology, 19.11.2020 20:40

Mathematics, 19.11.2020 20:40
Mathematics, 19.11.2020 20:40


