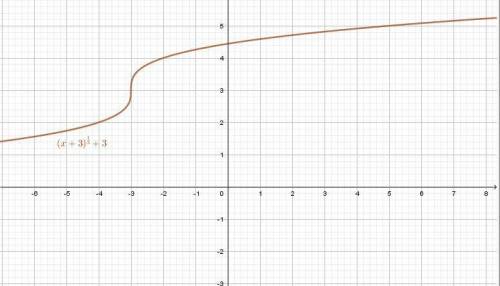
![y=\sqrt[3]{x+3}+3](/tpl/images/0282/2524/f0912.png)
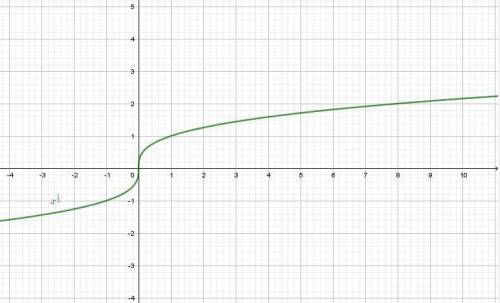
![y=\sqrt[3]{x}](/tpl/images/0282/2524/319c6.png)
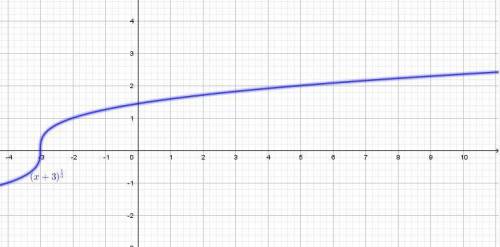
![y=\sqrt[3]{x+3}](/tpl/images/0282/2524/291ed.png)
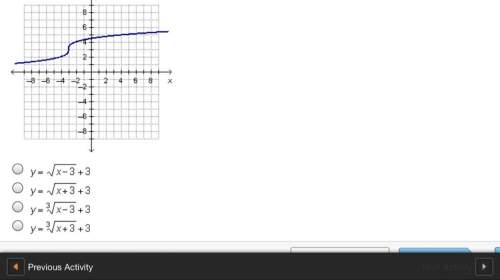
Which function represents the following graph?
...

Mathematics, 02.10.2019 06:00 esmemaluma00
Which function represents the following graph?

Answers: 1


Other questions on the subject: Mathematics
Mathematics, 21.06.2019 20:00, Chen5968
The distribution of the amount of money spent by students for textbooks in a semester is approximately normal in shape with a mean of $235 and a standard deviation of $20. according to the standard deviation rule, how much did almost all (99.7%) of the students spend on textbooks in a semester?
Answers: 2
Mathematics, 22.06.2019 01:00, wedestttefera
Urgent? will give brainliest to the first correct answer what is the area of the figure?
Answers: 3
Mathematics, 22.06.2019 05:00, emilyborland50
Simplify each expression using the definition, identities, and properties of imaginary numbers. match each term in the list on the left to its equivalent simplified form on the right. 1. (i 3)2(-i 0)3(3i 2)4 -4 2. (i 3i -5)2(i 4i -3)0 1 3. (-i 4i 2)(2i)2(i -1i 5)3(i 0)-3 -i 4. i 3[(i 2i 3i 4)(i 0i 2i 5)]2 81
Answers: 2
You know the right answer?
Questions in other subjects:

Mathematics, 14.09.2019 09:10


