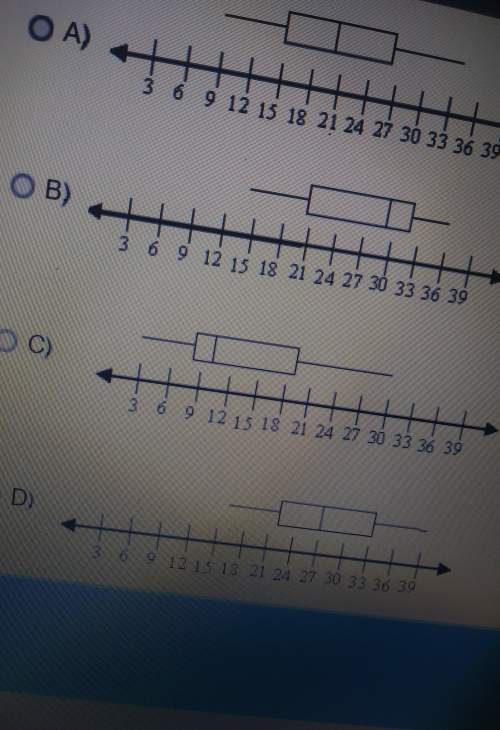
Which box and whisker plot best repersents the info from the data?
9 | 12 | 15 | 19 | 2...

Mathematics, 02.10.2019 03:00 Isaiahtate053
Which box and whisker plot best repersents the info from the data?
9 | 12 | 15 | 19 | 20 | 20 | 23 | 26 | 30 | 34 |

Answers: 1


Other questions on the subject: Mathematics
Mathematics, 20.06.2019 18:04, nommies005
Prove the divisibility of the following numbers: ! i have no any is 1. 16^5 + 2^15 by 33 2. 15^7 + 5^13 by 30
Answers: 1
Mathematics, 21.06.2019 19:30, jasminetaylor4587
According to the data set, where should the upper quartile line of the box plot be placed?
Answers: 1
Mathematics, 22.06.2019 02:00, ashiteru123
The function h (t) = -16t squared + 28t + 500 represents the height of a rock t seconds after it's propelled by a slingshot what does h (3.2) represent?
Answers: 1
Mathematics, 22.06.2019 03:30, baby092000
Pleas ! its urgent! what is the value of x? enter your answer in the box. mm
Answers: 3
You know the right answer?
Questions in other subjects:
Mathematics, 28.09.2019 16:30


Mathematics, 28.09.2019 16:30

Social Studies, 28.09.2019 16:30
Mathematics, 28.09.2019 16:30
Mathematics, 28.09.2019 16:30


