
Mathematics, 02.10.2019 01:10 18080980
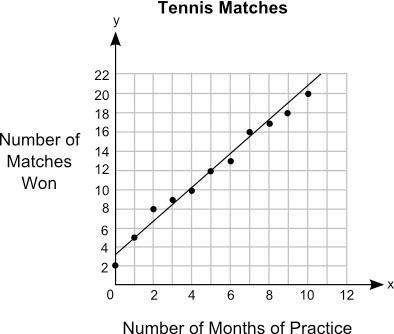
The graph shows the relationship between the number of months different students practiced tennis and the number of matches they won: .
part b: write the equation for the line of best fit in the slope-intercept form and use it to predict the number of matches that could be won after 13 months of practice show your work and include the points used to calculate the slope.

Answers: 2


Other questions on the subject: Mathematics
Mathematics, 21.06.2019 22:10, XxKaitlynnxX
What is the measure of sty in oo below? 130 310 230 50
Answers: 2
Mathematics, 21.06.2019 23:10, izzynikkie
Which graph represents the linear function below? y-4= (4/3)(x-2)
Answers: 2
You know the right answer?
The graph shows the relationship between the number of months different students practiced tennis an...
Questions in other subjects:


Physics, 12.11.2019 09:31

History, 12.11.2019 09:31
Mathematics, 12.11.2019 09:31


