
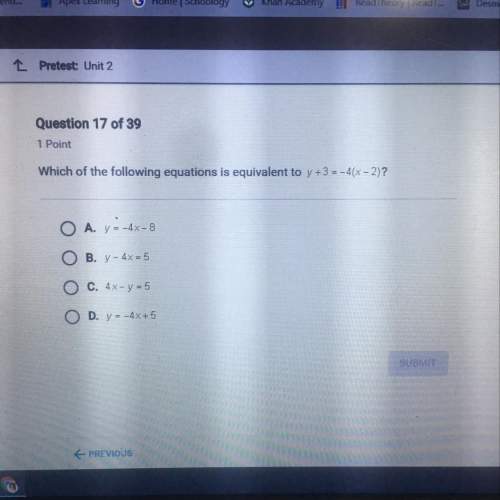
Mathematics, 27.09.2019 20:30 alexisgonzales4752
The graph shows the relationship between distance driven and gallons of gas used. continuous graph on a coordinate plane shows distance driven, numbered 20 to 60 along the horizontal axis, and gallons of gas used, numbered 1 to 4 on the vertical axis. solid circles appear at points (0, 0), (30, 1), (60, 2). use the graph to complete the statements. the car gets 30 miles to the gallon. after the car has traveled miles, 2 and two-thirdsgallons of gas have been consumed.

Answers: 2


Other questions on the subject: Mathematics
Mathematics, 21.06.2019 15:00, juju323261
With these: 18/36 = 1/? missing number change 1 5/8 to improper fraction. change 19/5 to a mixed number.
Answers: 1
You know the right answer?
The graph shows the relationship between distance driven and gallons of gas used. continuous graph o...
Questions in other subjects:

Mathematics, 04.08.2019 05:00


Mathematics, 04.08.2019 05:00
Mathematics, 04.08.2019 05:00
Mathematics, 04.08.2019 05:00


