The dot plots below show the ages of students belonging to two groups of music classes:
...

Mathematics, 27.09.2019 02:30 morrisjillian23
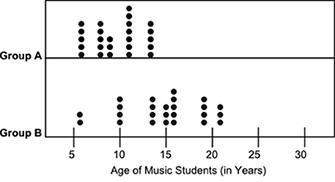
The dot plots below show the ages of students belonging to two groups of music classes:
a dot plot shows two divisions labeled group a and group b. the horizontal axis is labeled as age of music students in years. group a shows 5 dots at 6, 5 dots at 8, 3 dots at 9, 7 dots at 11, and 5 dots at 13. group b shows 2 dots at 6, 4 dots at 10, 4 dots at 13, 3 dots at 15, 5 dots at 16, 4 dots at 19, and 3 dots at 21.
based on visual inspection, which group most likely has a lower mean age of music students? explain your answer using two or three sentences. make sure to use facts to support your answer.

Answers: 1


Other questions on the subject: Mathematics
Mathematics, 21.06.2019 13:00, veronica25681
(6.03) what is the constant term in the expression 6x3y + 7x2 + 5x + 4? (input a numeric value only.) numerical answers expected! me pls! fast pls
Answers: 3
You know the right answer?
Questions in other subjects:


Physics, 02.07.2019 08:00

History, 02.07.2019 08:00
Mathematics, 02.07.2019 08:00

Social Studies, 02.07.2019 08:00


