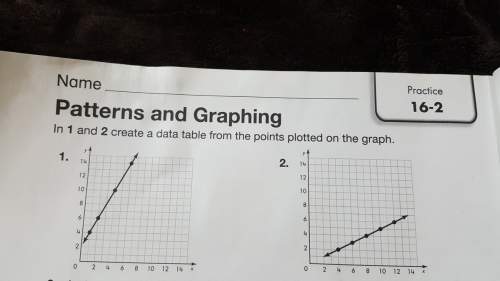
In 1 and 2 create a data table from the point plotted on the graph.
...

Mathematics, 28.09.2019 06:30 juliannabartra
In 1 and 2 create a data table from the point plotted on the graph.

Answers: 1


Other questions on the subject: Mathematics
Mathematics, 21.06.2019 17:00, hsernaykaw42
Use the frequency distribution, which shows the number of american voters (in millions) according to age, to find the probability that a voter chosen at random is in the 18 to 20 years old age range. ages frequency 18 to 20 5.9 21 to 24 7.7 25 to 34 20.4 35 to 44 25.1 45 to 64 54.4 65 and over 27.7 the probability that a voter chosen at random is in the 18 to 20 years old age range is nothing. (round to three decimal places as needed.)
Answers: 1
Mathematics, 21.06.2019 20:00, codyshs160
The boiling point of water at an elevation of 0 feet is 212 degrees fahrenheit (°f). for every 1,000 feet of increase in elevation, the boiling point of water decreases by about 2°f. which of the following represents this relationship if b is the boiling point of water at an elevation of e thousand feet? a) e = 2b - 212 b) b = 2e - 212 c) e = -2b + 212 d) b = -2e + 212
Answers: 1
You know the right answer?
Questions in other subjects:

English, 02.08.2019 07:10
Mathematics, 02.08.2019 07:10

Chemistry, 02.08.2019 07:10


