
Mathematics, 25.09.2019 17:30 klanclos1620
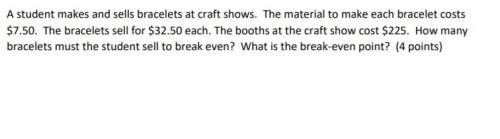
What is the average rate of change of f(x), represented by the graph, over the interval [-1,2]?
answer choices:
a. -2.5
b. -2
c. 2.5
d. 3
e. 6
![What is the average rate of change of f(x), represented by the graph, over the interval [-1,2]?](/tpl/images/08/25/QM2u9Msik435WfJu.jpg)

Answers: 1


Other questions on the subject: Mathematics
Mathematics, 21.06.2019 15:10, gwoodbyrne
Which of the following is a justification used while proving the similarity of triangles lom and mon
Answers: 1
Mathematics, 21.06.2019 15:30, fooligan3448
The local farm is advertising a special on fresh picked peaches. the farm charges $4.25 to pick your own peck of peaches and $3.50 for each additional peck you pick. write an equation for the total cost of peaches in terms of the number of pecks. deine your variables. how much does it cost to pick 3 pecks of peaches?
Answers: 3
Mathematics, 21.06.2019 16:30, itsdeevv
You drop a rubber ball off the roof of a 50 meter high building onto a paved parking lot. it bounces back up with every bounce, but not quite all the way back up to you. after the first bounce it bounces back only 80 percent of the distance it was dropped from. the pattern continues, meaning after every bounce it comes up to just 80 percent of the previous maximum height. so if before the first bounce the height is 50 meters, what height does the ball reach after the fifth bounce? round your answer to one decimal place and chose the correct response from the choices below:
Answers: 1
You know the right answer?
What is the average rate of change of f(x), represented by the graph, over the interval [-1,2]?
Questions in other subjects:


History, 24.11.2019 14:31
Mathematics, 24.11.2019 14:31


