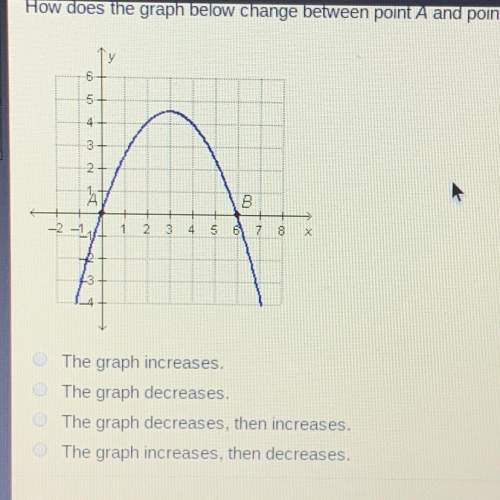
How does the graph below change between point a and point b
the graph increases.
the gra...

Mathematics, 23.09.2019 22:20 wowihavefun
How does the graph below change between point a and point b
the graph increases.
the graph decreases.
the graph decreases, then increases.
the graph increases, then decreases.

Answers: 2


Other questions on the subject: Mathematics
Mathematics, 21.06.2019 18:20, nehaljay1883
The first-serve percentage of a tennis player in a match is normally distributed with a standard deviation of 4.3%. if a sample of 15 random matches of the player is taken, the mean first-serve percentage is found to be 26.4%. what is the margin of error of the sample mean? a. 0.086% b. 0.533% c. 1.11% d. 2.22%
Answers: 1
Mathematics, 22.06.2019 00:00, victorialeona81
Find the root(s) of f (x) = (x- 6)2(x + 2)2.
Answers: 1
Mathematics, 22.06.2019 02:30, golffuture666
Ken earned $128 from his part-time job this summer. he spent 25% of his money on games. he is going to donate 1/6 of the remaining money to charity. how much money will the charity receive?
Answers: 1
You know the right answer?
Questions in other subjects:

Mathematics, 08.02.2021 07:50

History, 08.02.2021 07:50
Mathematics, 08.02.2021 07:50

English, 08.02.2021 07:50
Mathematics, 08.02.2021 07:50

Biology, 08.02.2021 07:50


