
Mathematics, 19.09.2019 00:30 itsRyanPlayzMC9660
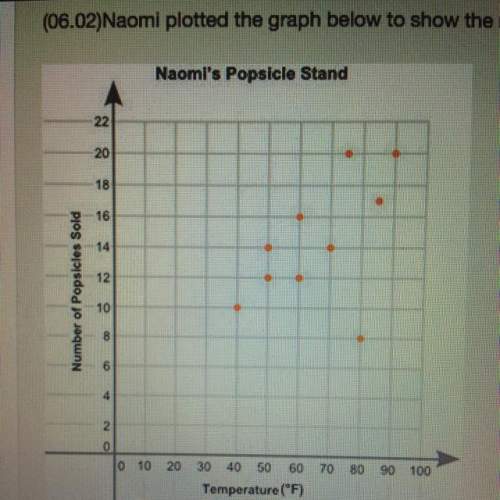
Naomi plotted the graph below to show the relationship between the temperature of her city and the number of popsicles she sold daily
describe how you can make the online of best fit. write the approximate slope and y-intercept of the line of best fit. show your work, including the points that you use to calculate the slope and y-intercept.

Answers: 3


Other questions on the subject: Mathematics
Mathematics, 21.06.2019 15:30, CoreyHammond1517
Click on the y intercept. -x +4 i know you cant click on it so could you just say the coordinates like (example - (1,0) you so much.
Answers: 2
Mathematics, 21.06.2019 23:00, mattdallas6214
Type the correct answer in each box. use numerals instead of words. the average number of subscribers to an online magazine each year from 2010 to 2015 is given in the table below. the average number of subscribers to the online magazine in 2010 was the percent increase in the average number of subscribers in 2011 to the average number of subscribers in 2012 was %. the maximum average number of subscribers to the online magazine in the years shown was
Answers: 2
Mathematics, 22.06.2019 00:30, lolagrace06
Me i’m stuck on all these questions besides the two bottom ones
Answers: 2
Mathematics, 22.06.2019 01:00, toribrown3773
Francis is getting new carpet tiles in his living room and den. his living room and den are connected. he needs to figure out how much carpet he needs and the cost involved. if each tile costs $2.00 per sq ft, how much would it cost to have new tile put in the den? a) $24 b) $36 c) $48 d) $54 plz awnser soon
Answers: 3
You know the right answer?
Naomi plotted the graph below to show the relationship between the temperature of her city and the n...
Questions in other subjects:

Mathematics, 01.12.2020 20:20


History, 01.12.2020 20:20

Biology, 01.12.2020 20:20
Mathematics, 01.12.2020 20:20


