1.
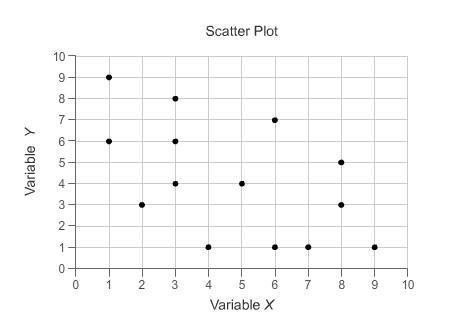
using the tables provided, create a scatterplot of the closing stock price each week for app...

Mathematics, 18.09.2019 23:30 katemsoo
1.
using the tables provided, create a scatterplot of the closing stock price each week for apple and southwest over the
twenty-day trading period. be sure to set up your scatterplots using appropriate labels on each axis and choosing
appropriate interval.
2. determine the equation for the line of best fit for your scatterplot. write the equation and graph the line on your
scatterplot.
3.
create a residual plot for your graph and explain why a linear model is or is not appropriate for the date
4.
if you had $5000 to invest at the currently traded price (as of 8/2/19), determine what your return on investment would
be for your company after 8 trading weeks. how much would you expect to have after 12 trading weeks? keep in mind
that the stock market does not trade on weekends or holidays)
5.
compare the results of your analysis of each company and write a summary of which stock would be the better
investment. make sure you cite specific reasons from your data, regression model, or residual plot.

Answers: 3


Other questions on the subject: Mathematics
Mathematics, 21.06.2019 14:30, smith3mgy
Simonne used the following steps to simplify the given expression. 12 - 3(-2x + 4) step 1: 12 + (–3)·(–2x) + (–3)·(4) step 2: 12 + 6x + (–12) step 3: 12 + (–12) + 6x step 4: 0 + 6x step 5: 6x what property of real numbers was used to transition from step 3 to step 4? a. identity property of addition b. inverse property of addition c. associative property of addition d. commutative property of addition
Answers: 1
Mathematics, 21.06.2019 20:20, rleiphart1
Which of the following values are in the range of the function graphed below? check all that apply ! - will give the answer "brainliest! "
Answers: 1
Mathematics, 21.06.2019 22:10, Jenifermorales101
Write the function for the graph. (1.8) (0,4)
Answers: 3
You know the right answer?
Questions in other subjects:


Health, 23.06.2021 03:30

Mathematics, 23.06.2021 03:30

Chemistry, 23.06.2021 03:30
Mathematics, 23.06.2021 03:30


