
Mathematics, 17.09.2019 20:00 sliverx201
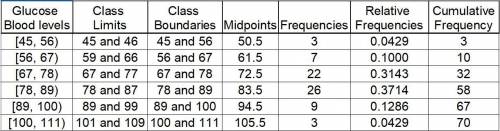
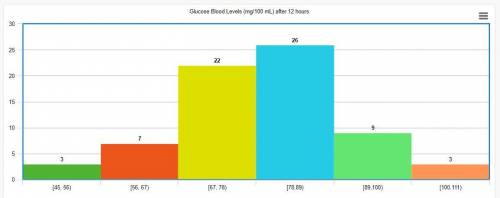
Ask your teacher the following data represent glucose blood levels (mg/100 ml) after a 12-hour fast for a random sample of 70 women (reference: american journal of clinical nutrition, vol. 19, pp. 345-351). 45 66 83 71 76 64 59 59 76 82 80 81 85 77 82 90 87 72 79 69 83 71 87 69 81 76 96 83 67 94 101 94 89 94 73 99 93 85 83 80 78 80 85 83 84 74 81 70 65 89 70 80 84 77 65 46 80 70 75 45 101 71 109 73 73 80 72 81 63 74
for this problem, use six classes.
(a) find the class width
(b) make a frequency table showing class limits, class boundaries, midpoints, frequencies, relative frequencies, and cumulative frequencies. (give relative frequencies to 4 decimal places.
(c) draw a histogram.

Answers: 1


Other questions on the subject: Mathematics
Mathematics, 21.06.2019 19:10, Lewis5442
Do more republicans (group a) than democrats (group b) favor a bill to make it easier for someone to own a firearm? two hundred republicans and two hundred democrats were asked if they favored a bill that made it easier for someone to own a firearm. how would we write the alternative hypothesis?
Answers: 1
You know the right answer?
Ask your teacher the following data represent glucose blood levels (mg/100 ml) after a 12-hour fast...
Questions in other subjects:
Mathematics, 16.10.2020 20:01

World Languages, 16.10.2020 20:01

Computers and Technology, 16.10.2020 20:01


Engineering, 16.10.2020 20:01


Chemistry, 16.10.2020 20:01


