
Mathematics, 14.09.2019 19:10 robert7248
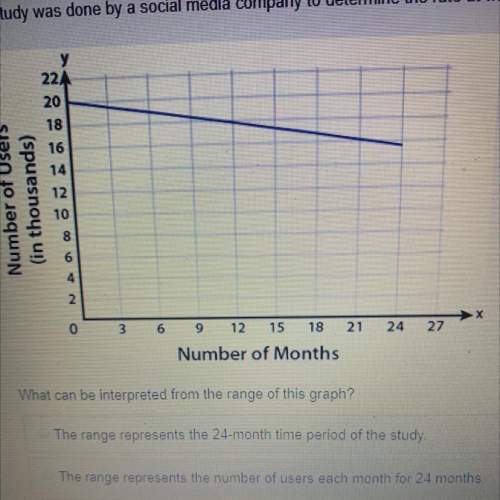
Astudy was done by a social media company to determine the rate at which users used its website. a graph of the data that was collected is shown
what can be interpreted from the range of this graph?
the range represents the 24-month time period of the study
the range represents the number of users each month for 24 months
the range represents the 20-month time period of the study
the range represents the number of users each month for 20 months

Answers: 1


Other questions on the subject: Mathematics
Mathematics, 21.06.2019 15:00, aubreerosehennessy95
55 bridesmaids want to make 325 325 decorations for a wedding. each decoration takes about 212 2 1 2 minutes to make. which response gives the best estimate for the amount of time each bridesmaid will spend making decorations?
Answers: 2
Mathematics, 21.06.2019 17:00, SoccerHalo
16. you're planning to buy a boat, a motor, and some miscellaneous boating equipment. the boat costs $325, the motor costs $225, and the equipment costs $79. if you've saved $438 toward these purchases, how much more do you need to save? a. $181 b. $281 c. $291 d. $191
Answers: 3
Mathematics, 21.06.2019 17:30, CarlosCooke2
You can find the constant of proportionality by finding the ratio of
Answers: 1
You know the right answer?
Astudy was done by a social media company to determine the rate at which users used its website. a g...
Questions in other subjects:


Geography, 15.04.2021 16:30

Mathematics, 15.04.2021 16:30
Mathematics, 15.04.2021 16:30
Mathematics, 15.04.2021 16:30
Mathematics, 15.04.2021 16:30


