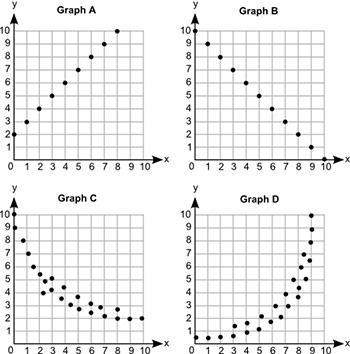
Four graphs are shown below:
four graphs are shown. all the graphs show scale on x axis and y...

Mathematics, 12.09.2019 03:30 loloroyroy264
Four graphs are shown below:
four graphs are shown. all the graphs show scale on x axis and y axis from 0 to 10 at increments of 1. graph a shows dots at ordered pairs 0, 2 and 1, 3 and 3, 5 and 4, 6 and 5, 7 and 6, 8 and 7, 9 and 8, 10. graph b shows dots at ordered pairs 0, 10 and 1, 9 and 2, 8 and 3, 7 and 4, 6 and 5, 5 and 6, 4 and 7, 3 and 8, 2 and 9, 1. graph c shows dots at ordered pairs 0, 10 and 0, 9 and 0.9, 8 and 1.1, 7 and 1.5, 6 and 2, 5.5 and 2.1, 4 and 2.5, 4.9 and 3, 4.1 and 3, 5.1 and 3.8, 3.5 and 3.9, 4.5 and 4.2, 3 and 5, 2.8 and 5, 3.8 and 6, 2.4 and 6, 3.1 and 6.8, 2.9 and 7, 2.1 and 8, 2 and 8, 2.8 and 9, 2 and 10, 2. graph d shows dots at the ordered pairs 0, 0.5 and 1, 0.5 and 2, 0.6 and 3, 0.8 and 3.1, 1.5 and 4, 0.9 and 4, 1.8 and 5, 1.1 and 5.1, 2.1 and 5.9, 1.9 and 6.1, 3 and 6.8, 2 and 7, 4 and 7.1, 3 and 7.6, 5 and 8, 3.8 and 8, 4.4 and 8.1, 6 and 8.5, 7 and 8.6, 5 and 8.8, 6.5 and 9, 8 and 9, 9 and 9, 10.
which graph represents a positive linear association between x and y?
graph a
graph b
graph c
graph d

Answers: 1


Other questions on the subject: Mathematics
Mathematics, 21.06.2019 18:30, jamilecalderonpalaci
Solve 2x2 + 8 = 0 by graphing the related function. there are two solutions: . there are no real number solutions. there are two solutions: 2 and -2
Answers: 3
Mathematics, 21.06.2019 23:00, erbnichole
Graph the system of equations on your graph paper to answer the question. {y=−x+4y=x−2 what is the solution for the system of equations? enter your answer in the boxes.
Answers: 1
You know the right answer?
Questions in other subjects:

Social Studies, 13.04.2021 16:40
Mathematics, 13.04.2021 16:40
Mathematics, 13.04.2021 16:40
Mathematics, 13.04.2021 16:40

English, 13.04.2021 16:40
Mathematics, 13.04.2021 16:40
Mathematics, 13.04.2021 16:40


