
Mathematics, 09.09.2019 21:30 raywils0n12300p0t3yc
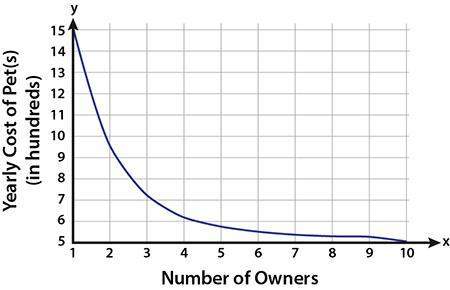
The finances of a group of pet owners were analyzed to determine how much they were spending on their pet(s) each year. a graph of that data is shown:
a graph with number of owners on the x axis and yearly cost of pets, in hundreds, on the y axis. the x axis has a scale from 1 to 10 with an increment of 1. the y axis has a scale of 5 to 15 with increments of 1. a curved line connecting 1, 15, approx 3, 7, and 10, 0 is drawn.
would (4.5, 6) be a realistic solution for the function? explain.
yes, it is realistic that owners spend $600 a year on their pet(s).
no, it is not realistic that owners spend $600 a year on their pet(s).
yes, it is realistic to have 4.5 owners.
no, it is not realistic to have 4.5 owners.

Answers: 2
 Number of owners
 Yearly cost of pets


Other questions on the subject: Mathematics
Mathematics, 21.06.2019 14:00, Badbpyz7987
(hurry! ) which expression is equivalent to the following complex fraction?
Answers: 1
Mathematics, 21.06.2019 23:00, jayjay2006
What is the value of n in the equation -1/2(2n+4)+6=-9+4(2n+1)
Answers: 1
You know the right answer?
The finances of a group of pet owners were analyzed to determine how much they were spending on thei...
Questions in other subjects:

Mathematics, 06.12.2020 07:00

Chemistry, 06.12.2020 07:00
Mathematics, 06.12.2020 07:00
Mathematics, 06.12.2020 07:00
Chemistry, 06.12.2020 07:00
Mathematics, 06.12.2020 07:00

History, 06.12.2020 07:00


