Mathematics, 07.09.2019 05:10 Ey3lean
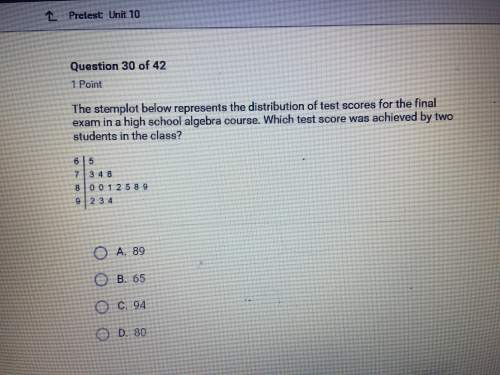
The stemplot below represents the distribution of test scores for the final exam in a high school algebra course. which test score was achieved by two students in the class


Answers: 2


Other questions on the subject: Mathematics

Mathematics, 21.06.2019 22:00, jessejames48
The coordinates r(1, -3), s(3, -1) t(5, -7) form what type of polygon? a right triangle an acute triangle an equilateral triangle an obtuse triangle
Answers: 1

Mathematics, 21.06.2019 22:30, jack487
Graph the system of inequalities presented here on your own paper, then use your graph to answer the following questions: y > 2x + 3y is less than negative 3 over 2 times x minus 4part a: describe the graph of the system, including shading and the types of lines graphed. provide a description of the solution area. (6 points)part b: is the point (â’4, 6) included in the solution area for the system? justify your answer mathematically. (4 points)
Answers: 1

Mathematics, 22.06.2019 01:00, lolhgb9526
Sanderson is having trouble with his assignment. his shown work is as follows: − 3 7 7 3 = − 3 7 × 7 3 = − 21 21 = −1 however, his answer does not match the answer that his teacher gives him. complete the description of sanderson's mistake. find the correct answer.
Answers: 3
You know the right answer?
The stemplot below represents the distribution of test scores for the final exam in a high school al...
Questions in other subjects:

Mathematics, 20.09.2020 19:01


Mathematics, 20.09.2020 19:01

Mathematics, 20.09.2020 19:01


Mathematics, 20.09.2020 19:01


Mathematics, 20.09.2020 19:01


