


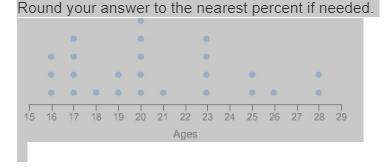
The line plot shows the ages of people taking a driving test at a certain station one day.
wha...

Mathematics, 29.08.2019 20:00 bnn29
The line plot shows the ages of people taking a driving test at a certain station one day.
what percent of the people are 18 or younger?
round your answer to the nearest percent if needed.
a line plot titled ages from 15 to 29. the plot displays the following values as dots above the corresponding value on the number line. three dots at 16. four dots at 17. one dot at 18. two dots at 19. five dots at 20. one dot at 21. four dots at 23. two dots at 25. one dot at 26. two dots at 28.
32%
28%
25%
17%

Answers: 3


Other questions on the subject: Mathematics
Mathematics, 21.06.2019 14:00, miriamnelson7545
△cde maps to △stu with the transformations (x, y) arrowright (x − 2, y − 2) arrowright (3x, 3y) arrowright (x, −y). if cd = a + 1, de = 2a − 1, st = 2b + 3 and tu = b + 6, find the values of a and b. the value of a is and the value of b is .
Answers: 1
You know the right answer?
Questions in other subjects:

Biology, 17.05.2021 20:10

Mathematics, 17.05.2021 20:10
Mathematics, 17.05.2021 20:10
Biology, 17.05.2021 20:10

English, 17.05.2021 20:10


