
Mathematics, 26.08.2019 03:10 isamar4348
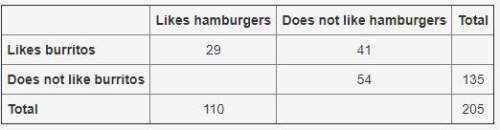
Afood truck did a daily survey of customers to find their food preferences. the data is partially entered in the frequency table. complete the table to analyze the data and answer the questions:
part a: what percentage of the survey respondents did not like either hamburgers or burritos?
part b: create a relative frequency table and determine what percentage of students who like hamburgers also like burritos.
part c: use the conditional relative frequencies to determine which two data point has strongest association of its two factors. use complete sentences to explain your answer.

Answers: 3


Other questions on the subject: Mathematics
Mathematics, 21.06.2019 14:30, sierram298
The multiplication property of zero states that the product of any number and 0 is 0. what must be true about either a or b to make ab=0
Answers: 1
Mathematics, 21.06.2019 15:30, williamnason123
Enter the missing numbers in the boxes to complete the table of equivalent ratios of lengths to widths. ? 18 8 ? 10 30 12 ?
Answers: 3
You know the right answer?
Afood truck did a daily survey of customers to find their food preferences. the data is partially en...
Questions in other subjects:
Mathematics, 20.09.2020 15:01

Mathematics, 20.09.2020 15:01
Mathematics, 20.09.2020 15:01
Mathematics, 20.09.2020 15:01


