
Mathematics, 19.08.2019 19:20 tai1611
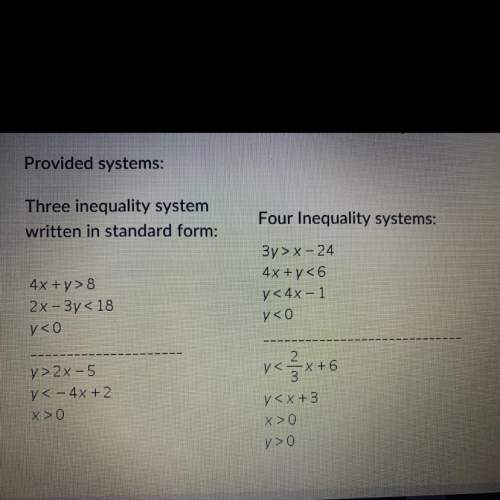
Graphing the solution region of a system of linear inequalities can get messy. brainstorm ways of graphing the solution region that are so messy. be creative. select one of the systems below and work it out step by step using your method. document each step either in a video or in an image.

Answers: 1


Other questions on the subject: Mathematics
Mathematics, 22.06.2019 00:00, genyjoannerubiera
Iwill arward ! , i if bt ≅ eu , bu ≅ et , prove: ∠b ≅ ∠e. fill in the blanks: draw segment ut ≅ bt≅ bu ≅ △ubt ≅ △
Answers: 1
Mathematics, 22.06.2019 01:30, alliemeade1
Jon’s weight loss for each week of the month is 5 lbs., 2.5 lbs., and 2.5 lbs. he gained 3.5 lbs. the last week. if jon originally weighed 198 lbs., how much does he weigh now?
Answers: 1
Mathematics, 22.06.2019 02:00, Renabelle5604
Which of the following is not a solution to the inequality graphed below? (-2, -4)(-1, -5)(0, -3)(2, -1)which of the following is a solution to the inequality graphed below? select all that apply.(-3, -3)(-1, -1)(-3, -1)(2, 2)
Answers: 1
You know the right answer?
Graphing the solution region of a system of linear inequalities can get messy. brainstorm ways of gr...
Questions in other subjects:

Health, 24.08.2019 19:30


Mathematics, 24.08.2019 19:30
Mathematics, 24.08.2019 19:30


