
Mathematics, 13.08.2019 12:10 mandoux
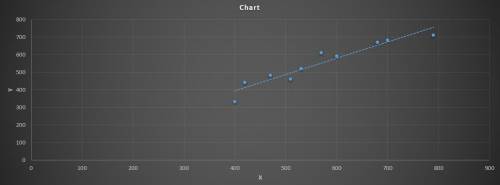
The sat math scores, x, and sat verbal scores, y, for ten high school students are shown in the table below.
x y
400 330
420 440
470 480
510 460
530 520
570 610
600 590
680 670
700 680
790 710
using a residual plot, determine if the following model is a good fit for the data in the table above.
no. the model is not a good fit because the residual plot has a random pattern.
yes. the model is a good fit because the residual plot has a random pattern.
no. the model is not a good fit because the residual plot does not have a random pattern.
yes. the model is a good fit because the residual plot does not have a random pattern.

Answers: 2


Other questions on the subject: Mathematics
Mathematics, 21.06.2019 17:00, sherlock19
If you apply the changes below to the absolute value parent function, f(x)=\x\, which of these is the equation of the new function? shift 2 units to the left shift 3 units down a. g(x)=\x-3\-2 b. g(x)= \x-2\-3 c. g(x)= \x+3\-2 d. g(x)= \x+2\-3
Answers: 1
Mathematics, 21.06.2019 21:00, Sadaalcala1
Ade and abc are similar. which best explains why the slope of the line between points a and d is the same as the slope between points a and b?
Answers: 2
Mathematics, 21.06.2019 21:30, madisonsimmons1120
Mon wants to make 5 lbs of the sugar syrup. how much water and how much sugar does he need… …to make 5% syrup?
Answers: 2
Mathematics, 21.06.2019 21:30, xxaurorabluexx
Use the method of cylindrical shells to find the volume v generated by rotating the region bounded by the curves about the given axis. y = 7ex, y = 7e^-x, x = 1; about the y-axis
Answers: 2
You know the right answer?
The sat math scores, x, and sat verbal scores, y, for ten high school students are shown in the tabl...
Questions in other subjects:


Biology, 11.12.2020 02:40
Mathematics, 11.12.2020 02:40
Mathematics, 11.12.2020 02:40


