
Mathematics, 11.08.2019 20:10 jennmcd17
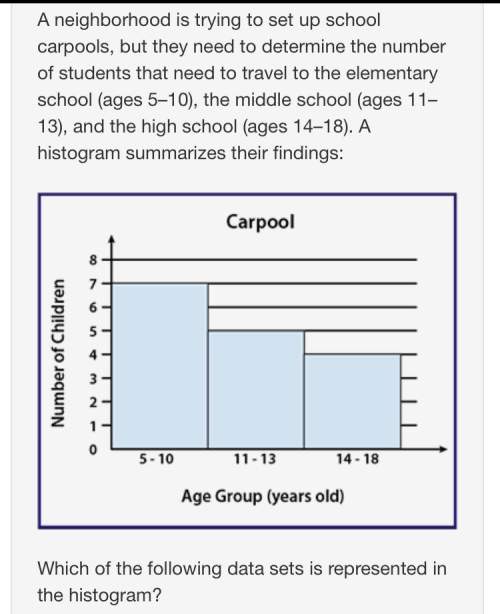
a neighborhood is trying to set up school carpools, but they need to determine the number of students that need to travel to the elementary school (ages 5–10), the middle school (ages 11–13), and the high school (ages 14–18). a histogram summarizes their findings:
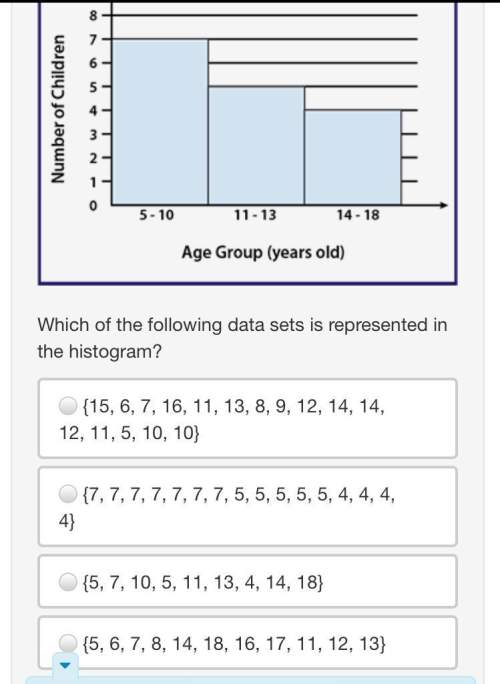
histogram titled carpool, with number of children on the y axis and age groups on the x axis. bar 1 is 5 to 10 years old and has a value of 7. bar 2 is 11 to 13 years old and has a value of 5. bar 3 is 14 to 18 years old and has a value of 4.
which of the following data sets is represented in the histogram?
{15, 6, 7, 16, 11, 13, 8, 9, 12, 14, 14, 12, 11, 5, 10, 10}
{7, 7, 7, 7, 7, 7, 7, 5, 5, 5, 5, 5, 4, 4, 4, 4}
{5, 7, 10, 5, 11, 13, 4, 14, 18}
{5, 6, 7, 8, 14, 18, 16, 17, 11, 12, 13}

Answers: 1


Other questions on the subject: Mathematics
Mathematics, 21.06.2019 19:00, amanda2517
To solve the system of equations below, pedro isolated the variable y in the first equation and then substituted it into the second equation. what was the resulting equation? { 5y=10x {x^2+y^2=36
Answers: 1
You know the right answer?
a neighborhood is trying to set up school carpools, but they need to determine the number of student...
Questions in other subjects:

History, 25.09.2019 04:00

Biology, 25.09.2019 04:00
Mathematics, 25.09.2019 04:00
Mathematics, 25.09.2019 04:00


Advanced Placement (AP), 25.09.2019 04:00


