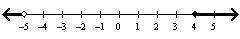
Write a compound inequality that the graph could represent.
a) x > -5 or x ≤ 4
b) x...

Mathematics, 11.08.2019 04:10 omarabady
Write a compound inequality that the graph could represent.
a) x > -5 or x ≤ 4
b) x < -4 or x ≥ 5
c) x < -5 or x ≥ 4
d) -4 ≤ x < 5

Answers: 1


Other questions on the subject: Mathematics
Mathematics, 22.06.2019 04:30, madpanda55
Atoss of a 20-sided die is equally likely to be any integer between 1 and 20 inclusive. what is the variance? provide your answer to two decimal points.
Answers: 1
You know the right answer?
Questions in other subjects:

Health, 18.12.2020 01:00
Mathematics, 18.12.2020 01:00


Mathematics, 18.12.2020 01:00

Chemistry, 18.12.2020 01:00


