
Mathematics, 06.08.2019 12:10 jadav350
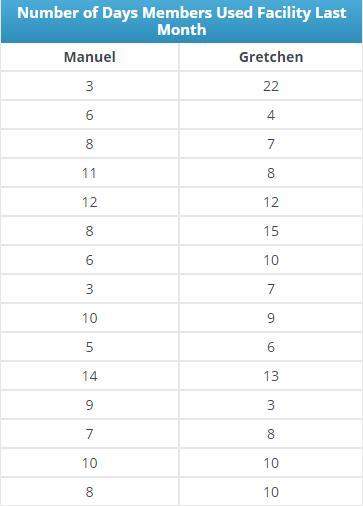
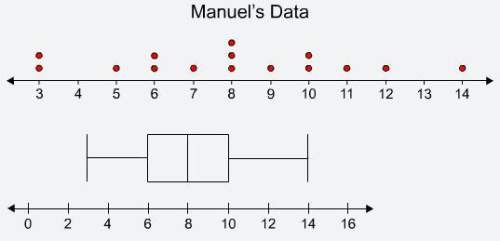
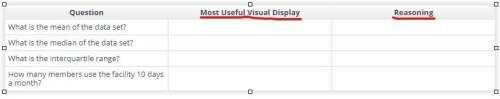
The dot plot and the box plot shown both represent manuel’s data. determine which visual display is more useful for answering each of the questions listed in the table, and explain your reasons.
the questions are in the third photo.

Answers: 1


Other questions on the subject: Mathematics
Mathematics, 21.06.2019 13:30, golderhadashaowtatz
Gabriel paints flower pots to sell at a craft fair. she paints 2/5 of a flower pot teal, 1/4 of it yellow, and the rest of it white. what fraction of the pot is painted either teal or yellow?
Answers: 3
Mathematics, 21.06.2019 17:30, mduncan840
The marriott family bought a new apartment three years ago for $65,000. the apartment is now worth $86,515. assuming a steady rate of growth, what was the yearly rate of appreciation? what is the percent of the yearly rate of appreciation?
Answers: 1
Mathematics, 21.06.2019 19:30, fraven1819
:24% of students in a class are girls. if there are less than 30 students in this class, how many students are there? how many girls are there?
Answers: 2
You know the right answer?
The dot plot and the box plot shown both represent manuel’s data. determine which visual display is...
Questions in other subjects:


Physics, 21.04.2021 18:30


Mathematics, 21.04.2021 18:30
Mathematics, 21.04.2021 18:30


