
Mathematics, 05.08.2019 19:30 lashaeperson
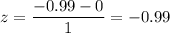
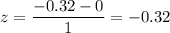
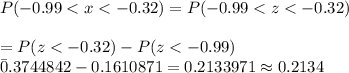
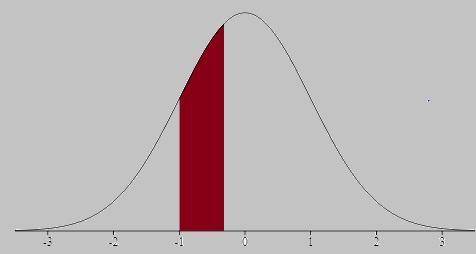
Assume the readings on thermometers are normally distributed with a mean of 0degreesc and a standard deviation of 1.00degreesc. find the probability that a randomly selected thermometer reads between negative 0.99 and negative 0.32 and draw a sketch of the region.

Answers: 3


Other questions on the subject: Mathematics
Mathematics, 21.06.2019 16:10, DepressionCentral
Which of the following graphs represents the function f(x) = 2^x
Answers: 2
You know the right answer?
Assume the readings on thermometers are normally distributed with a mean of 0degreesc and a standard...
Questions in other subjects:


Mathematics, 25.05.2021 17:50

Biology, 25.05.2021 17:50


