
Mathematics, 26.07.2019 20:10 genyjoannerubiera
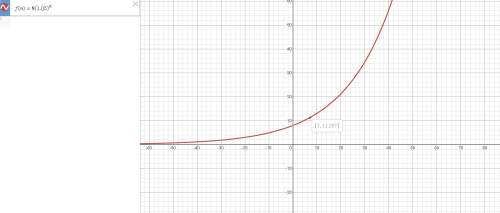
Ascientist is studying the growth of a particular species of plant. he writes the following equation to show the height of the plant f(n), in cm, after n days:
f(n) = 8(1.05)n
part a: when the scientist concluded his study, the height of the plant was approximately 11.26 cm. what is a reasonable domain to plot the growth function? (4 points)
part b: what does the y-intercept of the graph of the function f(n) represent? (2 points)
part c: what is the average rate of change of the function f(n) from n = 2 to n = 6, and what does it represent? (4 points)

Answers: 1


Other questions on the subject: Mathematics
Mathematics, 21.06.2019 14:20, TheViperMlg23676
What is the point-slope form of the equation for the line with a slope of -2 that passes through (1,4)?
Answers: 1
Mathematics, 21.06.2019 20:00, gordon57
Someone answer asap for ! max recorded the heights of 500 male humans. he found that the heights were normally distributed around a mean of 177 centimeters. which statements about max’s data must be true? a. the median of max’s data is 250 b. more than half of the data points max recorded were 177 centimeters. c. a data point chosen at random is as likely to be above the mean as it is to be below the mean. d. every height within three standard deviations of the mean is equally likely to be chosen if a data point is selected at random.
Answers: 1
You know the right answer?
Ascientist is studying the growth of a particular species of plant. he writes the following equation...
Questions in other subjects:
Mathematics, 06.09.2021 14:00
Mathematics, 06.09.2021 14:00


Business, 06.09.2021 14:00

Physics, 06.09.2021 14:00

Physics, 06.09.2021 14:00

Health, 06.09.2021 14:00

Social Studies, 06.09.2021 14:00
Mathematics, 06.09.2021 14:00


