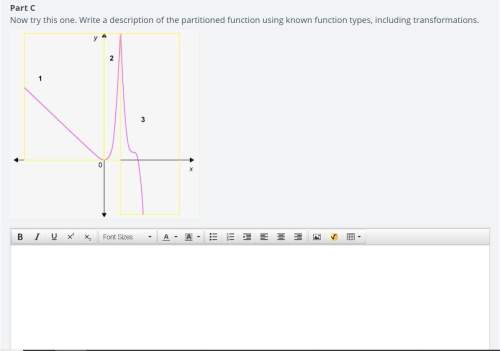
Need asap 44 !
part e: let’s say you had to make a prediction for the behavior of your data...

Mathematics, 26.07.2019 02:30 andy6128
Need asap 44 !
part e: let’s say you had to make a prediction for the behavior of your data set that extends beyond the existing data points. based on its end behavior, which type of function would best fit your scatter plot for long-term data projections? do transformations play a role? explain your reasoning.


Answers: 1


Other questions on the subject: Mathematics


Mathematics, 21.06.2019 21:10, linettepizarro1233
See attachment below and find the equivalent of tan(∠qsr)
Answers: 3


You know the right answer?
Questions in other subjects:

Mathematics, 21.05.2021 02:40

Mathematics, 21.05.2021 02:40


Mathematics, 21.05.2021 02:40


Chemistry, 21.05.2021 02:40

Health, 21.05.2021 02:40

Mathematics, 21.05.2021 02:40

History, 21.05.2021 02:40


