Will give brainliest
the graph below represents which system of inequalities?
a. y <...

Mathematics, 25.07.2019 15:10 jose200144
Will give brainliest
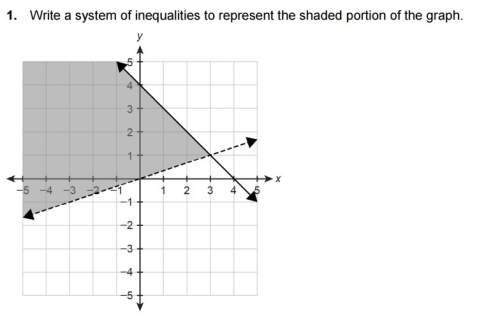
the graph below represents which system of inequalities?
a. y < −2x + 6
y ≤ x + 2
b. y ≤ −2x + 6
y < x + 2
c. y < 2 over 3 x − 2
y ≥ 2x + 2
d. none of the above

Answers: 1


Other questions on the subject: Mathematics
Mathematics, 21.06.2019 16:30, haleylecompte
Mexico city, mexico, is the world's second largest metropolis and is also one of its fastest-growing cities with a projected growth rate of 3.2% per year. its population in 1991 was 20,899,000 people. use the formula p = 20.899e0.032t to predict its population p in millions with t equal to the number of years after 1991. what is the predicted population to the nearest thousand of mexico city for the year 2010?
Answers: 2
Mathematics, 21.06.2019 21:30, jbismyhusbandbae
100 points? me its important ‼️‼️‼️‼️‼️‼️‼️‼️‼️‼️‼️
Answers: 1
Mathematics, 21.06.2019 22:00, deannajd03
Which two transformations are applied to pentagon abcde to create a'b'c'd'e'? (4 points) translated according to the rule (x, y) ? (x + 8, y + 2) and reflected across the x-axis translated according to the rule (x, y) ? (x + 2, y + 8) and reflected across the y-axis translated according to the rule (x, y) ? (x + 8, y + 2) and reflected across the y-axis translated according to the rule (x, y) ? (x + 2, y + 8) and reflected across the x-axis
Answers: 1
You know the right answer?
Questions in other subjects:

English, 18.09.2019 23:50
English, 18.09.2019 23:50


Social Studies, 18.09.2019 23:50

Biology, 18.09.2019 23:50


