
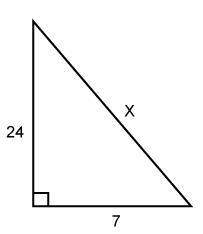
Mathematics, 22.07.2019 21:20 NewKidnewlessons
The following data represent the ph of rain for a random sample of 12 rain dates in a particular region. a normal probability plot suggests the data could come from a population that is normally distributed. a boxplot indicates there are no outliers. the sample standard deviation is s=0.306. construct and interpret a 99% confidence interval for the standard deviation ph of rainwater in this region.
5.20, 5.02, 4.87, 5.72, 4.57, 4.76, 4.99, 4.74, 4.56, 4.80, 5.19, 4.68

Answers: 1


Other questions on the subject: Mathematics
Mathematics, 21.06.2019 20:00, arianaaldaz062002
If the simple annual interest rate on a loan is 6, what is the interest rate in percentage per month?
Answers: 1
Mathematics, 21.06.2019 20:30, savannahvargas512
For g(x) = 5x - 3 and h(x) = [tex]\sqrt{x}[/tex], find (g · h)(4)
Answers: 1
You know the right answer?
The following data represent the ph of rain for a random sample of 12 rain dates in a particular reg...
Questions in other subjects:

Chemistry, 04.04.2020 00:30
Mathematics, 04.04.2020 00:30


History, 04.04.2020 00:30
Mathematics, 04.04.2020 00:30

Social Studies, 04.04.2020 00:30


