
Mathematics, 21.07.2019 20:10 netflixacc0107
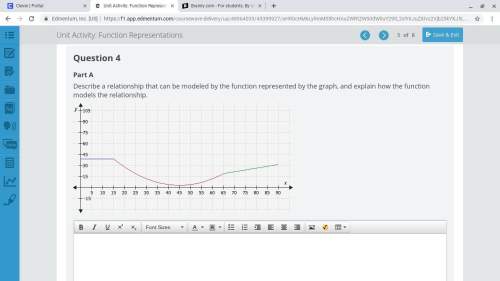
30 points describe a relationship that can be modeled by the function represented by the graph, and explain how the function models the relationship.


Answers: 1


Other questions on the subject: Mathematics
Mathematics, 21.06.2019 14:20, alissalhenry
If sin θ=24/25 and 0 less than or equal to θ less than or equal to π/2, find the exact value of tan 2θ. answers; a) -527/336 b) -336/527 c)7/24 d) 24/7
Answers: 3
Mathematics, 21.06.2019 15:30, nsuleban9524
Astore manager records the total visitors and sales, in dollars, for 10 days. the data is shown in the scatter plot. what conclusion can the store manager draw based on the data? question 3 options: an increase in sales causes a decrease in visitors. an increase in sales is correlated with a decrease in visitors. an increase in visitors is correlated with an increase in sales.
Answers: 1
You know the right answer?
30 points describe a relationship that can be modeled by the function represented by the graph, an...
Questions in other subjects:
Mathematics, 19.11.2021 21:20

French, 19.11.2021 21:20


Medicine, 19.11.2021 21:20
Mathematics, 19.11.2021 21:20

English, 19.11.2021 21:20

History, 19.11.2021 21:20


