
Mathematics, 17.07.2019 00:40 jorozco3209
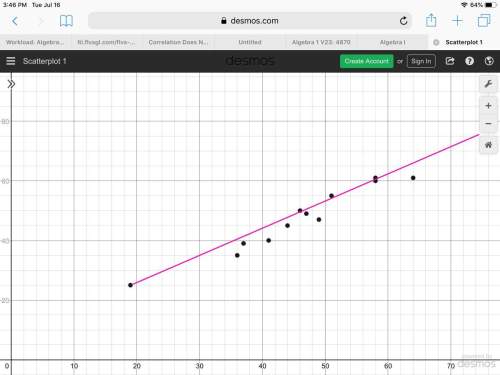
1. which variable did you plot on the x-axis, and which variable did you plot on the y-axis? explain why you assigned the variables in that way.
2. write the equation of the line of best fit using the slope-intercept formula y = mx + b. show all your work, including the points used to determine the slope and how the equation was determined.
3. what does the slope of the line represent within the context of your graph? what does the y-intercept represent?
4. test the residuals of two other points to determine how well the line of best fit models the data.
5. use the line of best fit to you to describe the data correlation.

Answers: 2


Other questions on the subject: Mathematics
Mathematics, 20.06.2019 18:04, nataliamontirl6079
About 400,000 people visited an art museum in december. what could be the exact number of people who visited the art museum?
Answers: 3
Mathematics, 21.06.2019 21:00, manasangreddy2921
Simplify -4z+2y-y+-18z a.-22z+y b.-14z+2 c.3y+22z d. y +14z
Answers: 1
Mathematics, 21.06.2019 23:10, kleighlamb4850
Which best describes the function on the graph? direct variation; k = −2 direct variation; k = -1/2 inverse variation; k = −2 inverse variation; k = -1/2
Answers: 2
You know the right answer?
1. which variable did you plot on the x-axis, and which variable did you plot on the y-axis? explai...
Questions in other subjects:


History, 27.01.2021 02:30

Chemistry, 27.01.2021 02:30
English, 27.01.2021 02:30


