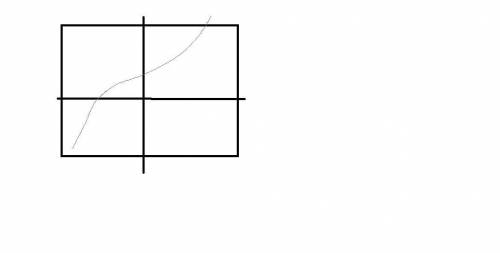
Which best describes the graph of the cubic function f(x) = x^3 +x^2 +x +1?
a. x increases, y...

Mathematics, 15.07.2019 20:20 Angelofpink2590
Which best describes the graph of the cubic function f(x) = x^3 +x^2 +x +1?
a. x increases, y increases along the entire graph.
b. as x increases, y increases, decreases, and then increases again.
c. as x increases, y decreases, increases and then decreases again.
d. as x increases, y decrease along the entire graph.

Answers: 2


Other questions on the subject: Mathematics
Mathematics, 22.06.2019 02:00, macinnoodlezz
What are linear equations? could'ya explain too me, ? ! and how do you see what graph is a proportional relationship?
Answers: 2
Mathematics, 22.06.2019 03:00, jonquil201
Benjamin believes that ¼ % is equivalent to 25%. is he correct? why or why not?
Answers: 1
Mathematics, 22.06.2019 04:30, gabbypittman20
Sally deposited money into a savings account paying 4% simple interest per year. the first year, she earned $75 in interest. how much interest will she earn during the following year?
Answers: 2
Mathematics, 22.06.2019 04:30, arianawelsh123l
Goods include kennels, leads, toys and similar accessories for pets what's percentages about what's percentages of the total amount spent on goods for $4736
Answers: 1
You know the right answer?
Questions in other subjects:


Business, 16.07.2021 06:00
Mathematics, 16.07.2021 06:00

Physics, 16.07.2021 06:00
Mathematics, 16.07.2021 06:00

Biology, 16.07.2021 06:00


