
Mathematics, 29.06.2019 00:10 peachyparty
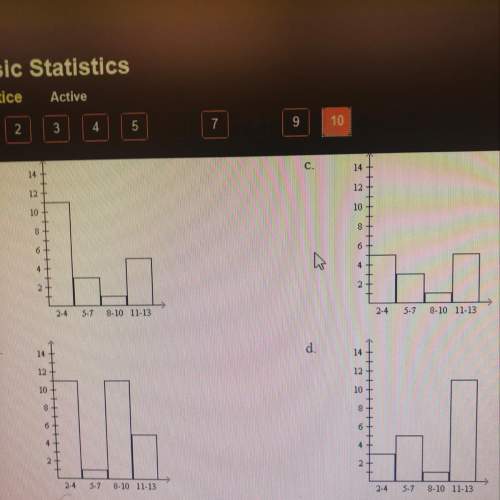
Draw a histogram for the intervals 2-4,5-7,8-10, and 11-13 using the following data: 11,3,13,4,2,2,13,3,6,4,6,11,4,13,7, 3,3,3,10,2

Answers: 1


Other questions on the subject: Mathematics
Mathematics, 21.06.2019 19:00, munozgiselle
If (x-2) 2= 49, then x could be a. -9 b. -7 c.- 2 d. 5 e.9
Answers: 2
Mathematics, 21.06.2019 23:30, heavenwagner
The volume of a box varies directly with its length if a box in the group has a length of 30inches and k=24 what is its volume
Answers: 1
Mathematics, 22.06.2019 02:00, torquishag
Tanyss's house has 25 windows. her brother has washed 22 of the windows. what percent of the windows has her brother washed?
Answers: 1
You know the right answer?
Draw a histogram for the intervals 2-4,5-7,8-10, and 11-13 using the following data: 11,3,13,4,2,2,...
Questions in other subjects:


Business, 21.01.2020 22:31


Physics, 21.01.2020 22:31


Chemistry, 21.01.2020 22:31


