Mathematics, 26.06.2019 06:20 skeletonorchestra
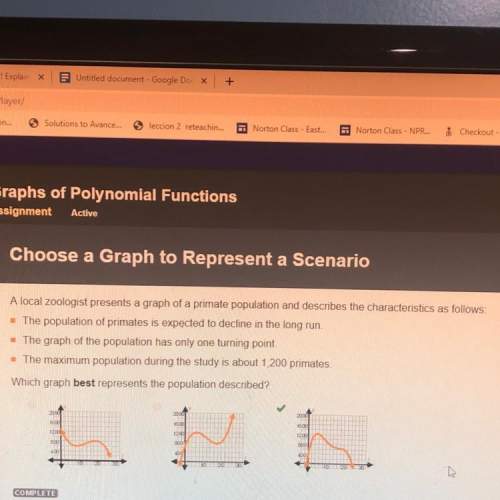
Alocal zoologist presents a graph of a primate population and describes the characteristics as follows:
the population of primates is expected to decline in the long run.
the graph of the population has only one turning point.
the maximum population during the study is about 1,200 primates.
which graph best represents the population described?
the answer is the third graph as seen in the picture


Answers: 1


Other questions on the subject: Mathematics


Mathematics, 22.06.2019 00:10, angelteddy033
Use your knowledge of the binary number system to write each binary number as a decimal number. a) 1001 base 2= base 10 b) 1101 base 2 = base 10
Answers: 1

Mathematics, 22.06.2019 00:40, williamlindley2
The length of the line segment ac is 8x-9 what is the value of x
Answers: 2
You know the right answer?
Alocal zoologist presents a graph of a primate population and describes the characteristics as follo...
Questions in other subjects:

Biology, 07.12.2021 01:30

Spanish, 07.12.2021 01:30

Spanish, 07.12.2021 01:30

Health, 07.12.2021 01:30

Biology, 07.12.2021 01:30


Social Studies, 07.12.2021 01:30

Mathematics, 07.12.2021 01:30

Geography, 07.12.2021 01:30


