
Mathematics, 11.10.2019 13:30 makaylamsikahema
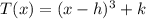
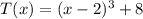
In your lab, a substance's temperature has been observed to follow the function t(x) = (x − 2)3 + 8. the turning point of the graph is where the substance changes from a solid to a liquid. using complete sentences in your written answer, explain to your fellow scientists how to find the turning point of this function. hint: the turning point of the graph is similar to the vertex of a quadratic function. (10 points).

Answers: 2


Other questions on the subject: Mathematics
Mathematics, 22.06.2019 00:20, kaybec2386
Data for the height of a model rocket launch in the air over time are shown in the table. darryl predicted that the height of the rocket at 8 seconds would be about 93 meters. did darryl make a good prediction? yes, the data are best modeled by a quadratic function. the value of the function at 8 seconds is about 93 meters. yes, the data are best modeled by a linear function. the first differences are constant, so about 93 meters at 8 seconds is reasonable. no, the data are exponential. a better prediction is 150 meters. no, the data are best modeled by a cubic function. a better prediction is 100 meters.
Answers: 2
Mathematics, 22.06.2019 03:20, Jspice2199
The equation ip| = 2 represents the total number of points that can be earned or lost during one turn of a game. which best describes how many points can be earned or lost during one turn?
Answers: 2
You know the right answer?
In your lab, a substance's temperature has been observed to follow the function t(x) = (x − 2)3 + 8....
Questions in other subjects:

Biology, 13.09.2019 18:30


