
Mathematics, 21.06.2019 23:40 preciosakassidy
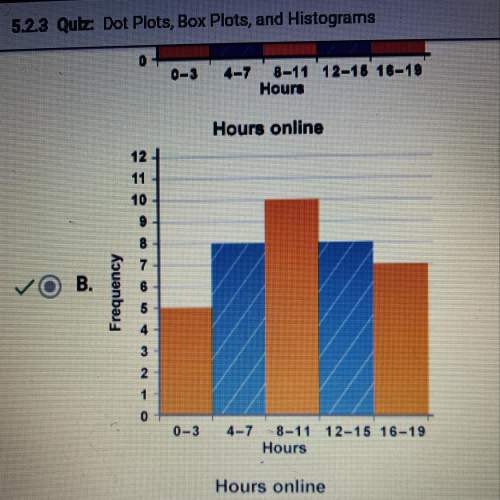
The frequency table shows the results of a survey asking people how many hours they spend online per week. on a piece of paper, draw a histogram to represent the data. then determine which answer choice matches the histogram you drew. in order here is the.. hours online: 0-3, 4-7, 8-11, 12-15, and 16-19. frequency: 5, 8, 10, 8, 7 answer for the question is in the picture! : )

Answers: 2


Other questions on the subject: Mathematics
Mathematics, 21.06.2019 18:00, Kellystar27
Someone this asap for a group of students attends a basketball game. * the group buys x hot dogs at the concession stand for $2 each. * the group buys y drinks at the concession stand for $3 each. the group buys 29 items at the concession stand for a total of $70. how many hot dogs did the group buy?
Answers: 1
You know the right answer?
The frequency table shows the results of a survey asking people how many hours they spend online per...
Questions in other subjects:
Mathematics, 02.09.2019 09:10

History, 02.09.2019 09:10


History, 02.09.2019 09:10

Chemistry, 02.09.2019 09:10


