
Mathematics, 25.12.2019 04:31 jonathanvega424
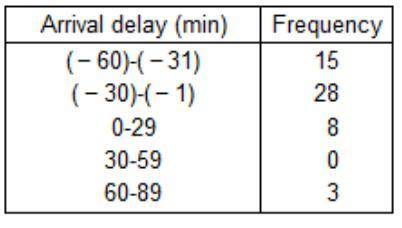
The frequency distribution below shows arrival delays for airplane flights. arrival delay (min) frequency (minus−−31) (minus−−1) 0-29 30-59 60-89 1010 2828 88 11 22 use the frequency distribution to construct a histogram. which part of the histogram depicts flights that arrived early, and which part depicts flights that arrived late?

Answers: 1


Other questions on the subject: Mathematics
Mathematics, 21.06.2019 17:10, shayneseaton
Find the value of x for which the lines are parallel.
Answers: 1
Mathematics, 21.06.2019 21:30, oliup567
(c) the diagram shows the first three shapes of a matchsticks arrangement. first shape = 3second shape = 5third shape = 7given m represents the number of matchstick used to arrange the n'th shape.(i) write a formula to represent the relation between m and n. express m as the subjectof the formula.(ii) 19 matchsticks are used to make the p'th shape. find the value of p.
Answers: 2
You know the right answer?
The frequency distribution below shows arrival delays for airplane flights. arrival delay (min) freq...
Questions in other subjects:
Mathematics, 15.03.2020 23:44
Mathematics, 15.03.2020 23:44

English, 15.03.2020 23:44
Mathematics, 15.03.2020 23:44
Mathematics, 15.03.2020 23:45

Business, 15.03.2020 23:45


