
Mathematics, 17.10.2019 14:30 jazzhands16
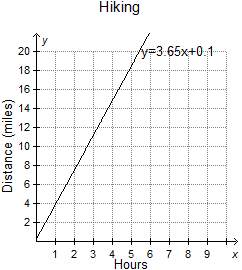
The graph shows the best-fit regression model for a set of data comparing the number of hours spent hiking and the number of miles traveled in one day.
which is most likely true of the data set represented by the regression model on the graph?
a) each point in the data set falls on the regression line.
b)the regression model is an accurate representation of the distance for any number of hours hiked.
c)each point in the data set is near the regression line.
d)the regression model is inaccurate, as it does not begin at (0, 0). \

Answers: 3


Other questions on the subject: Mathematics
Mathematics, 21.06.2019 21:10, verdolaga2017me
What is the domain of the given function? {(3,-2), (6, 1), (-1, 4), (5,9), (-4, 0); o {x | x= -4,-1, 3, 5, 6} o {yl y = -2,0, 1,4,9} o {x|x = -4,-2, -1,0, 1, 3, 4, 5, 6, 9} o y y = 4,-2, -1, 0, 1, 3, 4, 5, 6, 9}
Answers: 1
Mathematics, 21.06.2019 22:30, angeleyes4u610p6np54
Which of the following would be a reasonable estimate for the weight of a pencil? a. 1 × 10^-20 lb b. 1 × 10^20 lb c. 1 × 10^2 lb d. 1 × 10^-2 lb
Answers: 1
Mathematics, 22.06.2019 03:00, jasmindelvalle78
The curved part of the figure is the semicircle what is the best approximation for the area of this figure
Answers: 3
You know the right answer?
The graph shows the best-fit regression model for a set of data comparing the number of hours spent...
Questions in other subjects:
Mathematics, 28.07.2021 01:00

Arts, 28.07.2021 01:00
Mathematics, 28.07.2021 01:10
Mathematics, 28.07.2021 01:10


