
Mathematics, 27.06.2019 16:40 gutierrezaandrea56
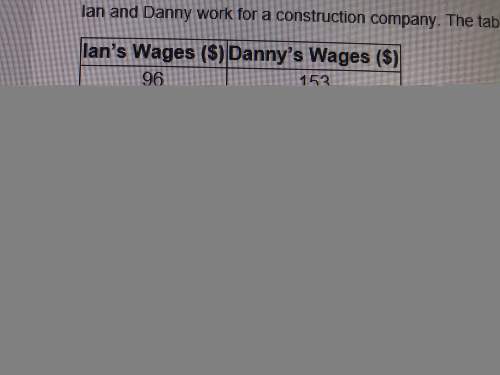
Ian and danny work for a construction company. the table shows their daily wages (in dollars) for a week picked randomly from the calendar year. ian’s wages ($) danny’s wages ($) 96 153 120 89 114 91 111 96 106 129 123 94 110 99 the best way to compare ian’s and danny's wages is by using the as the measure of center. comparing this measure of center of the two data sets indicates that generally earned higher wages during the days listed. first blank mean medianmean absolute deviation interquartile range second blank ian danny

Answers: 3


Other questions on the subject: Mathematics
Mathematics, 21.06.2019 21:10, samiam61
Which question is not a good survey question? a. don't you agree that the financial crisis is essentially over? 63on average, how many hours do you sleep per day? c. what is your opinion of educational funding this year? d. are you happy with the availability of electronic products in your state?
Answers: 2
You know the right answer?
Ian and danny work for a construction company. the table shows their daily wages (in dollars) for a...
Questions in other subjects:

English, 10.09.2020 03:01

Geography, 10.09.2020 03:01

Mathematics, 10.09.2020 03:01
Mathematics, 10.09.2020 03:01
English, 10.09.2020 03:01


