
Mathematics, 27.06.2019 18:40 dozsyerra
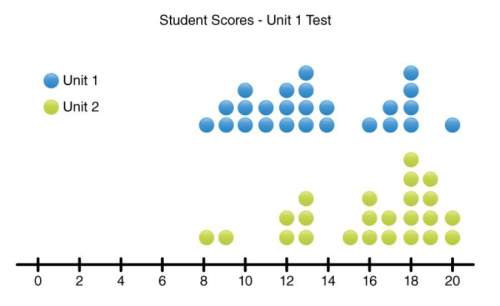
The following dot plot represents student scores on both the unit 1 and unit 2 math tests. scores are in whole number increments. part 1: looking at the data plots, which test do you think the students scored better on? do you think one of the tests has more variation than the other or is the variation about the same for both tests? use complete sentences in your answer and explain your reasoning. part 2: calculate the mean (rounded to the nearest whole number) and mean absolute deviation for the unit 1 test. part 3: do your results from part b prove or disprove your hypotheses from part a? use complete sentences in your answer and explain your reasoning.

Answers: 3


Other questions on the subject: Mathematics
Mathematics, 21.06.2019 16:30, alexcuevaz90
Why do interests rates on loans to be lower in a weak economy than in a strong one
Answers: 3
Mathematics, 21.06.2019 18:00, Megcuttie101
What is the measure of the smallest angle in the diagram? 15 29 32 45
Answers: 2
You know the right answer?
The following dot plot represents student scores on both the unit 1 and unit 2 math tests. scores ar...
Questions in other subjects:

Mathematics, 01.03.2021 19:40


History, 01.03.2021 19:40

World Languages, 01.03.2021 19:40


