Hello!
The answer is:
The first and second options:
f(x) and g(x) intersect at exactly two points.
The x-intercepts of f(x) are common to g(x)
Why?
To find the correct option (or options) , we need to remember the following:
- When a function intercepts the y-axis, it means that the "x" coordinate will be equal to 0.
- When a function intercepts the x-axis, it means that the "y" coordinate will be equal to 0.
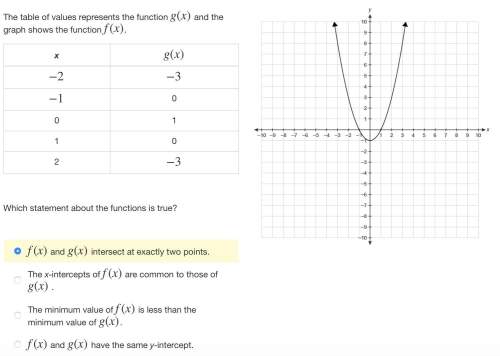
Now, to find the correct option, we also need to compare the graphed function (f(x)) to the given table (g(x)).
So, discarding each of the given options to find the correct option, we have:
- First option, f(x) and g(x) intersect at exactly two points: True.
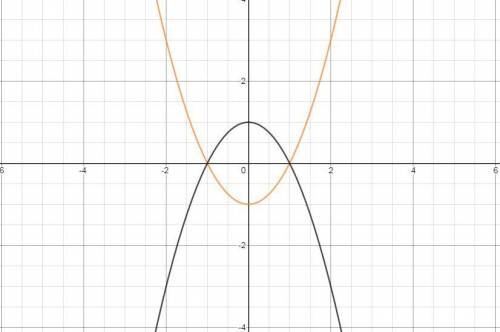
From the graph we can see that f(x) intercepts the x-axis at two points (-1,0) and (1,0), also, from the table we can see that g(x) intercepts the x-axis at the same two points (-1,0) and (1,0), it means that the functions intersect at exactly two points.
Hence, we have that f(x) and g(x) intersect at exactly two points.
- Second option, the x-intercepts of f(x) are common to g(x): True.
From the graph we can see that f(x) intercepts the x-axis at two points (-1,0) and (1,0), also, from the table we can see that g(x) intercepts the x-axis at the same two points (-1,0) and (1,0), so, both functions intercepts the x-axis at common points.
Hence,we have that the x-intercepts of f(x) are common to g(x)
- Third option, he minimum value of f(x) is less than the minimum value of g(x): False.
From the graph, we can see that the minimum value of f(x) is located at the point (0,-1), also, from the given table for g(x) we can see that there are values below the point (2,-3), meaning that the minimum value of f(x) is NOT less than the minimum value of g(x).
Hence, we have that the minimum value of f(x) is NOT less than the minimum value of g(x).
- Fourth option, f(x) and g(x) have the same y-intercept: False.
We can see that for the function f(x) the y-intercept is located at (0,-1) while from the given table, we can see the y-intercept for the function g(x) is located at (0,1)
Hence, we have that f(x) and g(x) have differents y-intercepts.
Therefore, the correct answers are:
The first and second options:
f(x) and g(x) intersect at exactly two points.
The x-intercepts of f(x) are common to g(x)
Have a nice day!
Note: I have attached an image for better understanding.