
Mathematics, 29.06.2019 21:40 mydoggy152
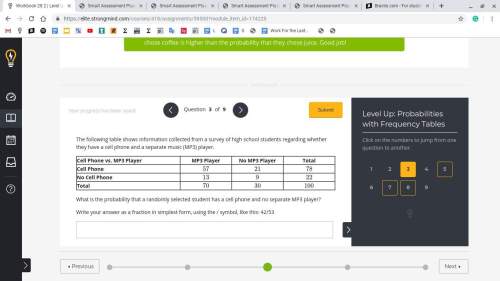
Table chart problem the following table shows information collected from a survey of high school students regarding whether they have a cell phone and a separate music (mp3) player. what is the probability that a randomly selected student has a cell phone and no separate mp3 player?

Answers: 3


Other questions on the subject: Mathematics
Mathematics, 21.06.2019 18:20, ellenharley7
What value of x is in the solution set of 4x - 12 s 16 + 8x? -10 -9 -8 -7
Answers: 1
Mathematics, 21.06.2019 19:00, ktenz
Asmall business produces and sells balls. the fixed costs are $20 and each ball costs $4.32 to produce. each ball sells for $8.32. write the equations for the total cost, c, and the revenue, r, then use the graphing method to determine how many balls must be sold to break even.
Answers: 3
Mathematics, 21.06.2019 21:30, isamilo520
Consider a bag that contains 220 coins of which 6 are rare indian pennies. for the given pair of events a and b, complete parts (a) and (b) below. a: when one of the 220 coins is randomly selected, it is one of the 6 indian pennies. b: when another one of the 220 coins is randomly selected (with replacement), it is also one of the 6 indian pennies. a. determine whether events a and b are independent or dependent. b. find p(a and b), the probability that events a and b both occur.
Answers: 2
Mathematics, 22.06.2019 01:00, cthompson1107
First work with stencil one. use a combination of reflections, rotations, and translations to see whether stencil one will overlap with the original pattern. list the sequence of rigid transformations you used in your attempt, noting the type of transformation, the direction, the coordinates, and the displacement in
Answers: 3
You know the right answer?
Table chart problem the following table shows information collected from a survey of high school stu...
Questions in other subjects:

History, 19.10.2019 16:30
Mathematics, 19.10.2019 16:30

History, 19.10.2019 16:30

French, 19.10.2019 16:30

World Languages, 19.10.2019 16:30

Biology, 19.10.2019 16:30

Mathematics, 19.10.2019 16:30


